|
Self-Similarity for Change Detection
The Idea
Detecting changes in time series is a very important issue as it allows the identification of faults and unforeseen evolutions of the data-generating process. In contrast with standard approaches that rely on predictive or approximating models of the time series, we leverage the self-similarity of the time series to perform change detection. In fact, time-series are often characterized by a large degree of self-similarity, which arises in application domains featuring periodicity or seasonality (an example is shown in Fig.1). In particular, we present a novel change-detection test (CDT) to detect structural changes in time series exhibiting self-similarity, namely permanent shifts of the data-generating process that moves from an in-control to an out-of-control state.
Fig.1: An example of water-flow measurements in the Water Distribution Network (WDN) of Barcelona, Spain. The customary habits of citizens induce a daily trend in the water demand which makes the time series highly self-similar. Change Detection Exploiting Self-Similarity We design an online and sequential CDT for time series exhibiting self-similarity. In particular, we address the problem of detecting structural changes that affect the degree to which the time series is self-similar, introducing patterns that are highly dissimilar to those generated in stationary conditions, as illustrated in Fig.2.
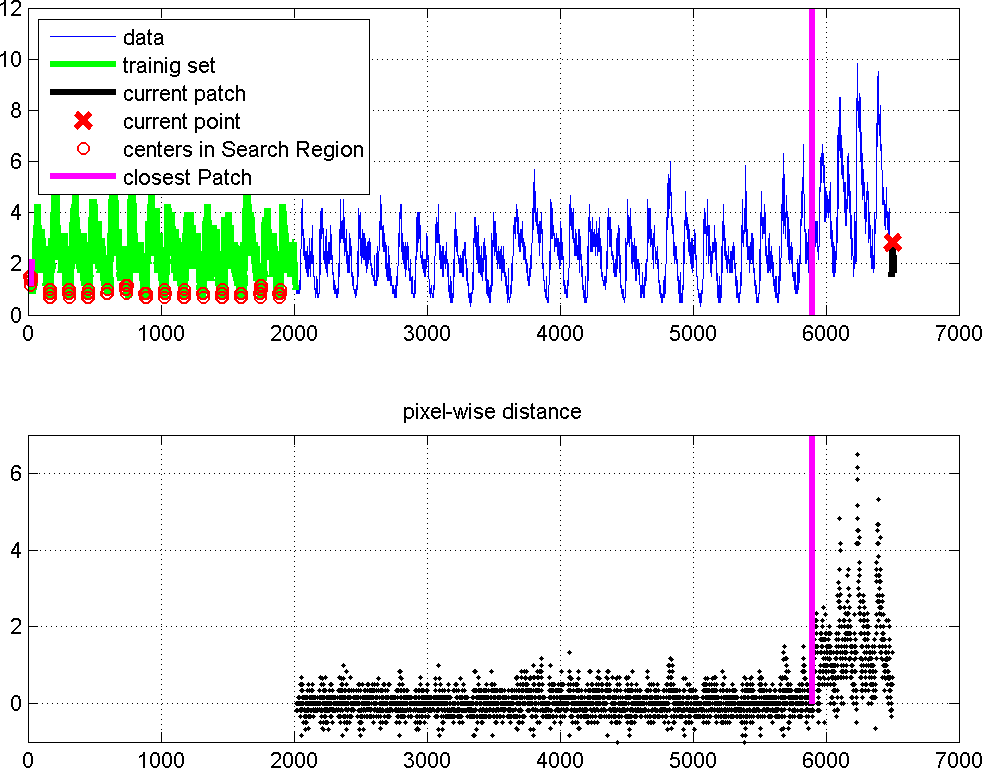
Fig.2: An example of a structural change that affects the self-similarity of the time series. In this case, the change has been synthetically introduced at the magenta line by juxtaposition of measurement acquired in different points of the WDN. Core of the proposed solution is the definition of a change indicator that quantitatively assesses the self-similarity of the time series over time. The change indicator measures the degree to which recent samples are similar to those belonging to an initial, change-free, training sequence, and as such reveals structural changes affecting the self-similarity of the time series. In practice, a patch (i.e., a segment of consecutive samples) is cropped around each new sample and this patch is compared against all the patches in the training sequence. We thus identify the patch in the training sequence that is most similar to the current one and we compute the change indicator as the difference between the values at the center of the two patches.Fig.3 shows that the change indicator is indeed a meaningful quantity for detecting structural changes. Please refer to [Boracchi and Roveri. 2014] for a detailed description of the change indicator.
Fig.3: Before the change (magenta line), the values of the change indicators can be considered as independent and identically distributed realization of a random variable from an unknown distribution. In contrast, after the change, their distribution changes and this suggests that the change indicator is a meaningful quantity to monitor by using a statistical CDT. Departures from the in-control state can be then detected by monitoring any variation in the statistical behavior of change indicator by means of a statistical CDT. In particular, in [Boracchi and Roveri. 2014] we adopt a CDT of the ICI-based CDTs family [Alippi et al. 2011 b], which extracts a set of features from monitored data and assesses the stationarity of these features by means of the ICI rule [Goldenshluger and Nemirovski 1997]. Codes and Dataset are available for download The Matlab package contains the ICI-based CDT for self-similarity. A script (demo.m) illustrates the basic usage of this CDT.
Slides of our presentation at IJCNN 2014 are available for download here. |
|
References [Boracchi and Roveri. 2014] Exploiting Self-Similarity for Change Detection [Alippi et al. 2011 a] A Hierarchical, Nonparametric Sequential Change-Detection Test
[Alippi et al. 2011 b] A just-in-time adaptive classification system based on the intersection of confidence intervals rule,
[Goldenshluger and Nemirovski 1997] On spatial adaptive estimation of nonparametric regression. |


