Contents
close all
clear
clc
addpath(genpath('C:\Users\Giacomo Boracchi\Dropbox (DEIB)\Didattica\2020_Computer_Vision_Pattern_Recognition_USI\Materiali\Zisserman_Codes\VGG-Multiple-View-Geometry-master'));
FNT_SZ = 28;
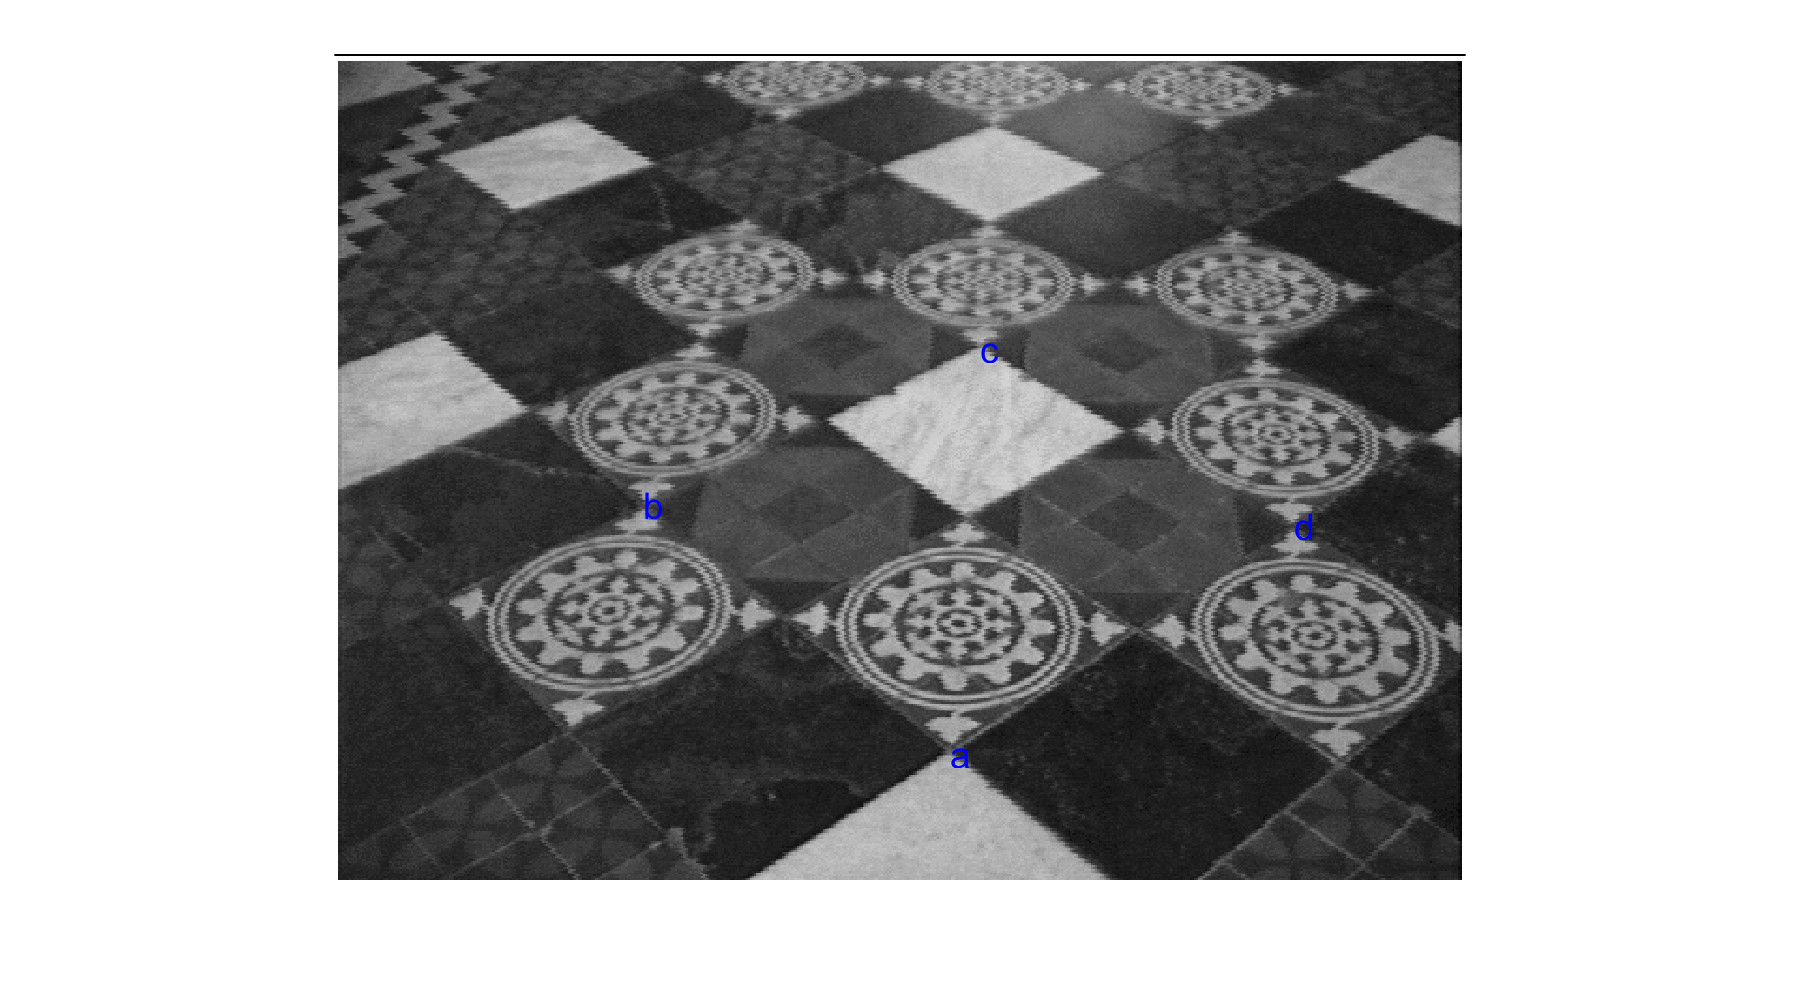
I = imread('projgeomfigs-chapel.png');
Warning:
Too many
IDAT's
found.
The image
data may
be
corrupt.
select a few points
figure(1), imshow(I);
hold on;
[x, y] = getpts();
a = [x(1); y(1); 1];
b = [x(2); y(2); 1];
c = [x(3); y(3); 1];
d = [x(4); y(4); 1];

text(a(1), a(2), 'a', 'FontSize', FNT_SZ, 'Color', 'b')
text(b(1), b(2), 'b', 'FontSize', FNT_SZ, 'Color', 'b')
text(c(1), c(2), 'c', 'FontSize', FNT_SZ, 'Color', 'b')
text(d(1), d(2), 'd', 'FontSize', FNT_SZ, 'Color', 'b')
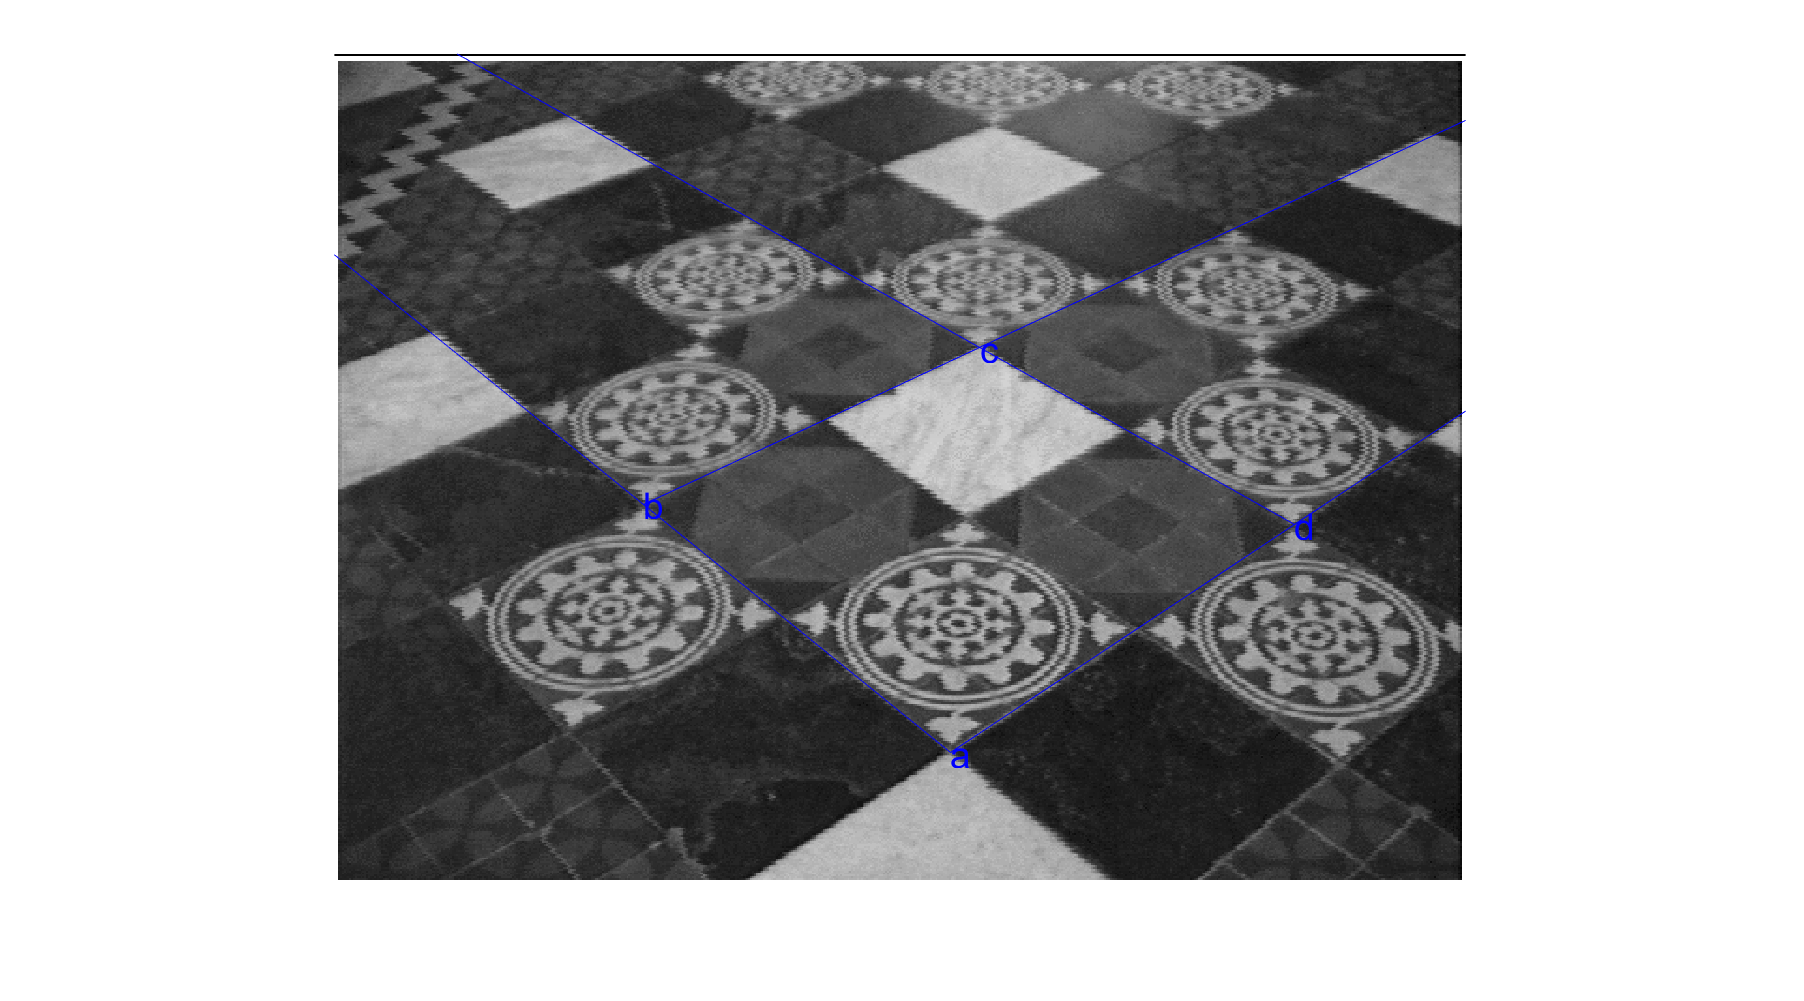
compute lines passing through points
lab = cross(a, b);
lbc = cross(b, c);
lcd = cross(c, d);
lda = cross(d, a);
find vanishing points
v1 = cross(lab, lcd);
v2 = cross(lbc, lda);
v1 = v1/v1(3);
v2 = v2/v2(3);
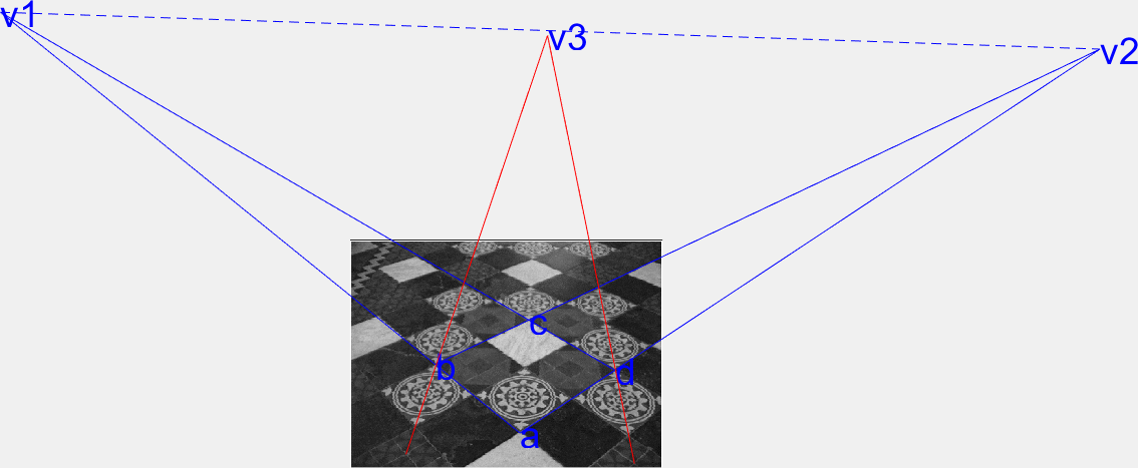
compute the horizon line (this is the image of the line at the infinity associated to the plane in 3D)
horz = cross(v1, v2);
draw a few lines and show they intersect at the horizon
plot([a(1), v1( 1)], [a(2), v1(2)], 'b');
plot([d(1), v1(1)], [d(2), v1(2)], 'b');
plot([b(1), v1(1)], [b(2), v1(2)], 'b');
plot([c(1), v1(1)], [c(2), v1(2)], 'b');

plot([a(1), v2(1)], [a(2), v2(2)], 'b');
plot([c(1), v2(1)], [c(2), v2(2)], 'b');
plot([b(1), v2(1)], [b(2), v2(2)], 'b');
plot([d(1), v2(1)], [d(2), v2(2)], 'b');

plot([v1(1), v2(1)], [v1(2), v2(2)], 'b--')
text(v1(1), v1(2), 'v1', 'FontSize', FNT_SZ, 'Color', 'b')
text(v2(1), v2(2), 'v2', 'FontSize', FNT_SZ, 'Color', 'b')

hold off
Select another pair of parallel lines
disp('Select another pair of parallel lines');
figure(1),
hold on;
[x, y] = getpts();
e = [x(1); y(1); 1];
f = [x(2); y(2); 1];
g = [x(3); y(3); 1];
h = [x(4); y(4); 1];
Select another pair of parallel lines

compute line passing through these
lef = cross(e, f);
lgh = cross(g, h);
compute their intersection (vanishing point)
v3 = cross(lef, lgh);
v3 = v3 / v3(3);
check whether v3 it belongs to horizon
horz' * v3

plot([e(1), v3(1)], [e(2), v3(2)], 'r');
plot([g(1), v3(1)], [g(2), v3(2)], 'r');
text(v3(1), v3(2), 'v3', 'FontSize', FNT_SZ, 'Color', 'b')
ans =
  -1.0098e+05