Contents
% this script demonstrates the use of sequential RanSaC to fit multiple
% fundamental matrices
% IACV 2020 Luca Magri
% Politecnico di Milano

addpath('model_spec');
%addpath(genpath('/Users/lucamagri/Activities/Develop/Codes/tslnk'));
close all;
clear variables;
load data
temp = load('breadtoy.mat');
img1  = temp.img1;
img2  = temp.img2;
G = temp.label(:);
X = temp.data;
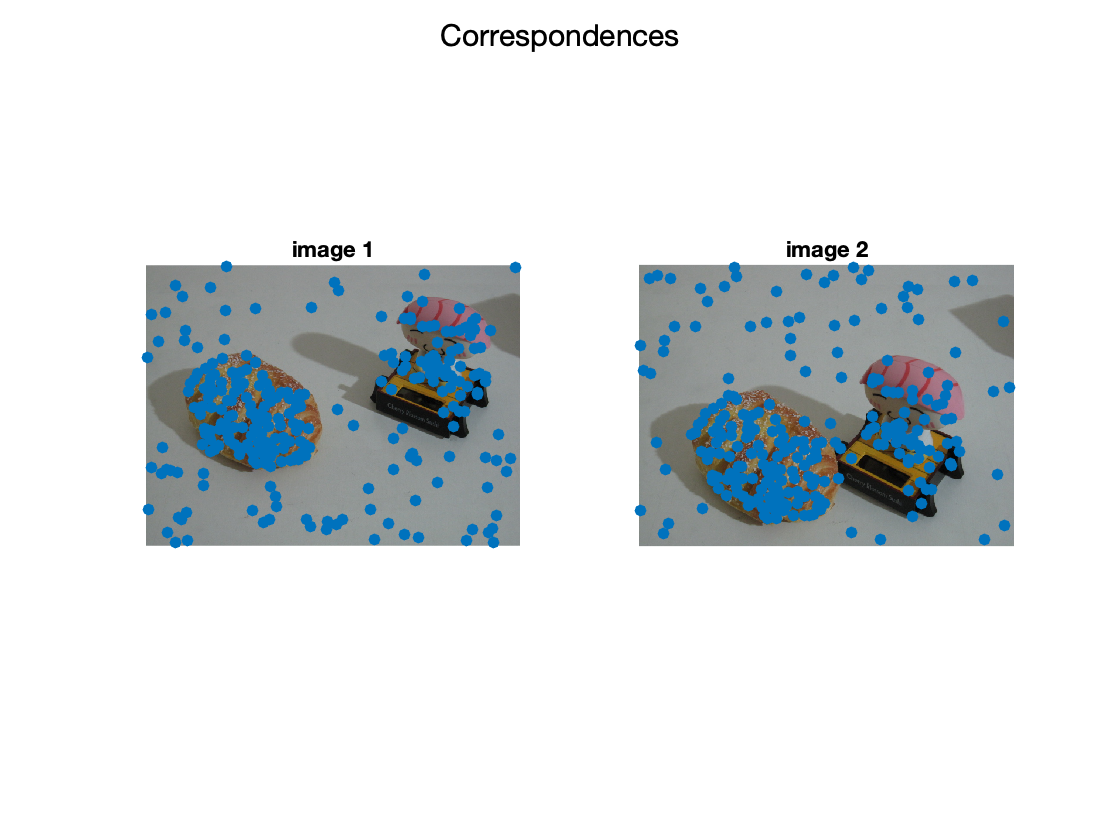
show input data
figure;
subplot(1,2,1);
imshow(img1);
hold on;
scatter(X(1,:),X(2,:),'filled');
title('image 1')
subplot(1,2,2);
imshow(img2);
hold on;
scatter(X(4,:),X(5,:),'filled');
title('image 2');
sgtitle('Correspondences');
perform MSAC to estimate a fundamental matrix
modelfit = @fit_fm; % specify the function to fit a fundamental matrix
modeldist = @res_fm; % specify the function to compute the sampson distance between matches and fundamental matrix
p = 8; % size of the minimum sample set
t = 5; % inlier threhsold

% naive implementation of simpleMSAC (uncomment to play with it)
%[inliers, F] = simpleMSAC(X,modelfit, modeldist, p, t);
%F = fit_fm(X(:,inliers));
%inliers = res_fm(F,X)<t;

[F,inliers] = estimateFundamentalMatrix(X(1:2,:)',X(4:5,:)','Method','MSAC','DistanceType','sampson','DistanceThreshold',t,'NumTrials',5000);
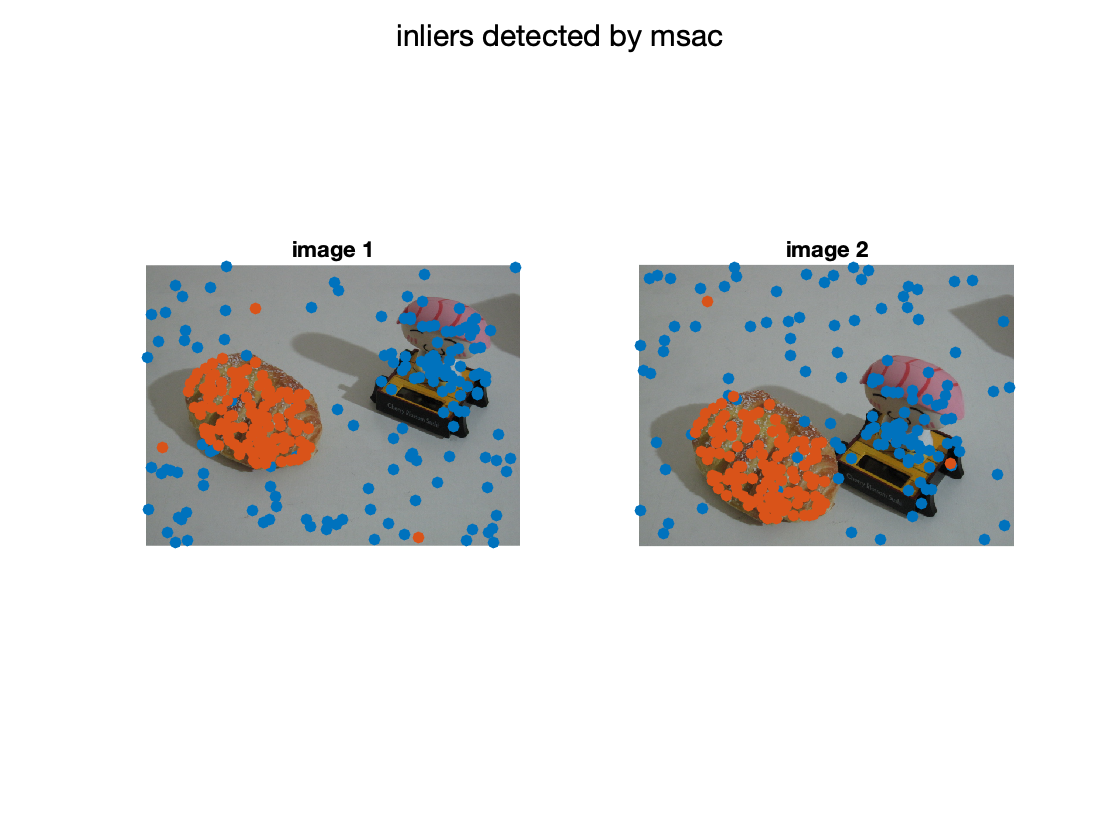
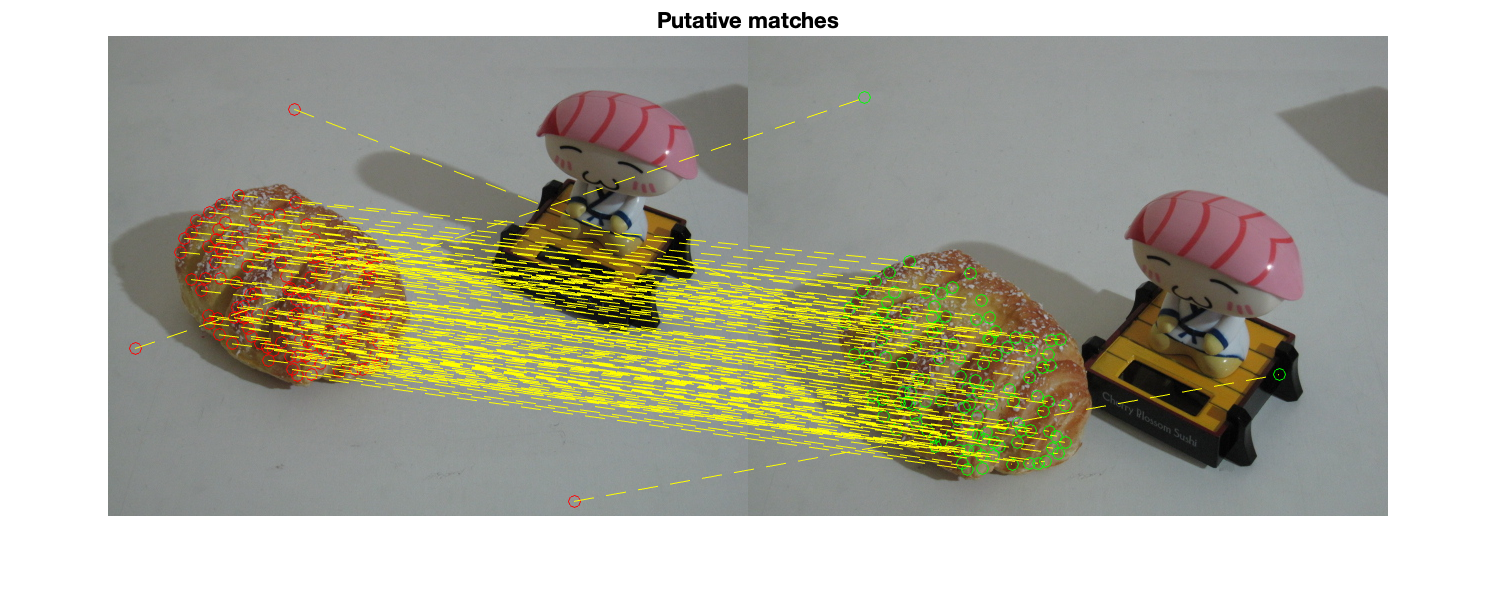
display the result
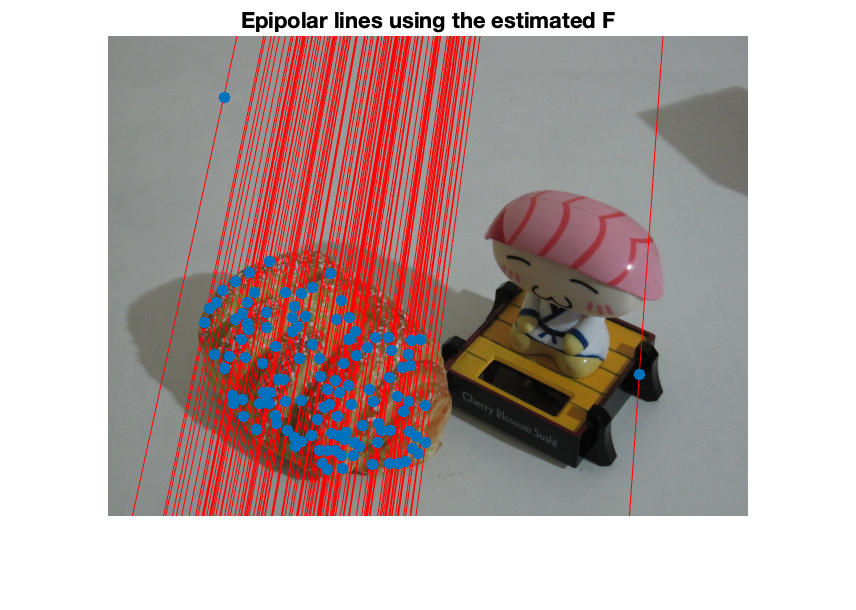
figure;
subplot(1,2,1);
imshow(img1);
hold all;
scatter(X(1,:),X(2,:),'filled');
scatter(X(1,inliers),X(2,inliers),'filled');
title('image 1')
subplot(1,2,2);
imshow(img2);
hold all;
scatter(X(4,:),X(5,:),'filled');
scatter(X(4,inliers),X(5,inliers),'filled');
title('image 2');
sgtitle('inliers detected by msac');

% display matched inliers
figure;
showMatchedFeatures(img1,img2,X(1:2,inliers)',X(4:5,inliers)','montage','PlotOptions',{'ro','go','y--'});
title('Putative matches');

% display the epipolar lines in the second image
% inlers should be close to their corresponding epipolar line
epiLines = epipolarLine(F,X(1:2,inliers)');
points = lineToBorderPoints(epiLines,size(img2));
figure; imshow(img2);
hold all;
line(points(:,[1,3])',points(:,[2,4])','Color','red');
scatter(X(4,inliers),X(5,inliers),'filled');
title('Epipolar lines using the estimated F');
apply sequential MSAC
iteratively fit a fundamental matrix and extract inliers
Y = X;
C = zeros(size(X,2),1);
cont = 1;

minNumPoints = 100;

while(size(Y,2)>minNumPoints)
    [F,inliers] = estimateFundamentalMatrix(Y(1:2,:)',Y(4:5,:)','Method','MSAC','DistanceType','sampson','DistanceThreshold',t,'NumTrials',5000);
    C(C==0) = cont*inliers;

    Y(:,inliers) =[]; % remove found inliers
    cont = cont+1;
end
Warning: Maximum number of trials reached. Consider increasing the maximum
distance or decreasing the desired confidence.
Warning: Maximum number of trials reached. Consider increasing the maximum
distance or decreasing the desired confidence.
Warning: Maximum number of trials reached. Consider increasing the maximum
distance or decreasing the desired confidence.
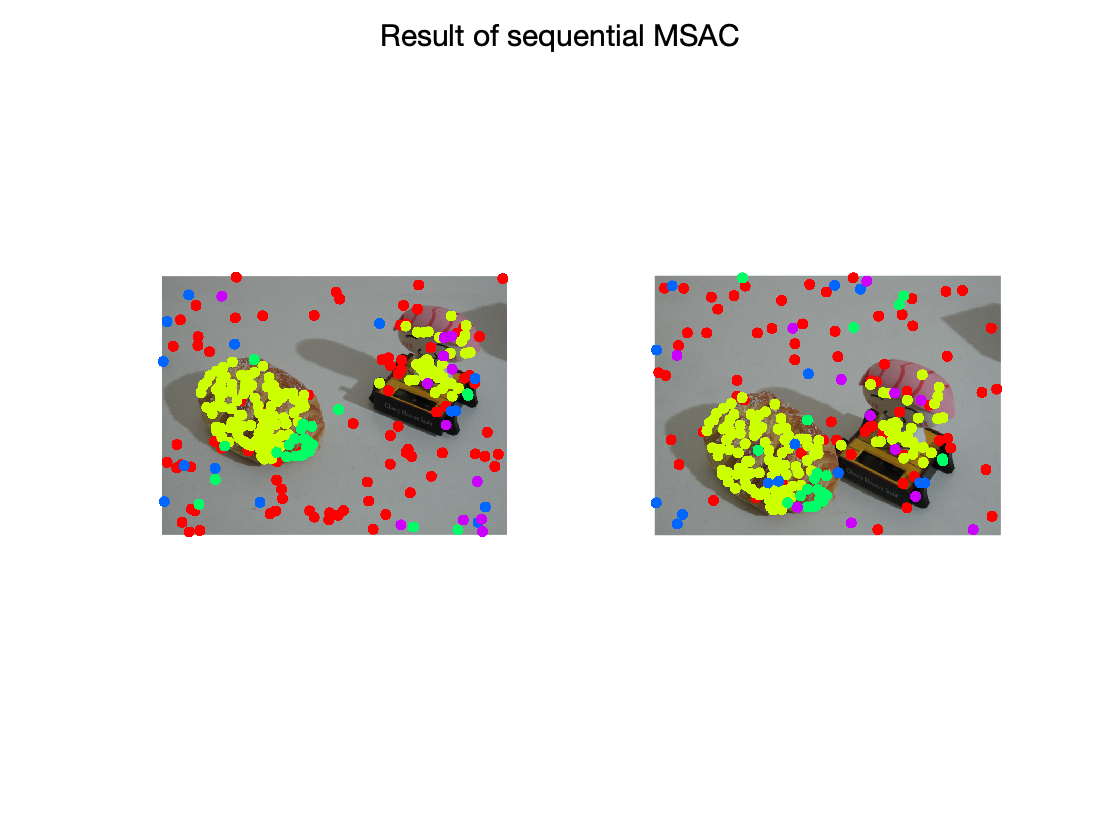
show the results
color-coded inliers of different fundamental matrices
figure;
subplot(1,2,1);
imshow(img1);
hold on;
gscatter(X(1,:),X(2,:),C);
legend off;
subplot(1,2,2);
imshow(img2);
hold all;
gscatter(X(4,:),X(5,:),C);
legend off;
sgtitle('Result of sequential MSAC')