Contents
Keypoint Detection
Giacomo Boracchi
References [1] C. Harris and M. Stephens "A combined corner and edge detector" 1988, Proceedings of the 4th Alvey Vision Conference. pp. pp 147--151. http://www.bmva.org/bmvc/1988/avc-88-023.pdf
[2] Alison Noble, "Descriptions of Image Surfaces", PhD thesis, Department of Engineering Science, Oxford University 1989, p45.
close all
clear
clc

do_use_harris = 1;
compute the Harris measure as in [1]
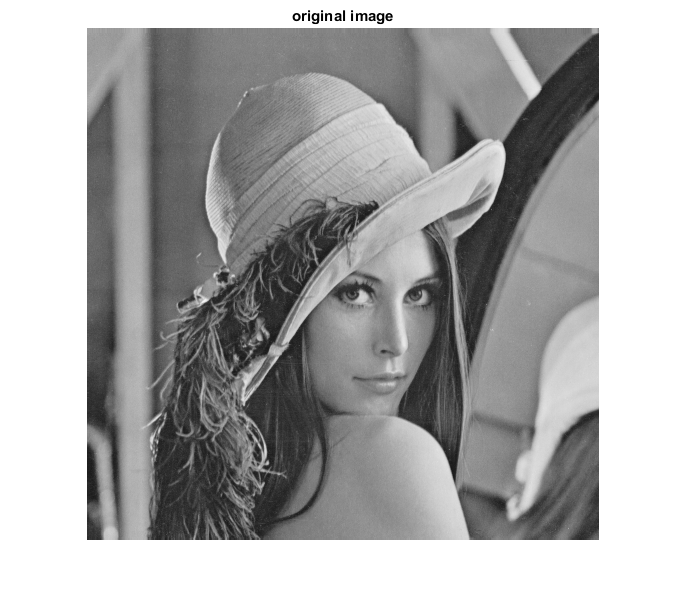
y=im2double(imread('../Lez3/image_lena512.png'));
figure(1), imshow(y),title('original image');

dx = [-1 0 1; -1 0 1; -1 0 1];   % Derivative masks
dy = dx';

Ix = conv2(y, dx, 'same');      % Image derivatives
Iy = conv2(y, dy, 'same');

% set the parameter for Gaussian convolution used in Harris Corner Detector
SIGMA_gaussian=4
g = fspecial('gaussian',max(1,fix(3*SIGMA_gaussian)+1), SIGMA_gaussian);

Ix2 = conv2(Ix.^2, g, 'same'); % Smoothed squared image derivatives
Iy2 = conv2(Iy.^2, g, 'same');
Ixy = conv2(Ix.*Iy, g, 'same');

% cim = det(M) - k trace(M)^2.
if do_use_harris
    k = 0.04;
    cim = (Ix2.*Iy2 - Ixy.^2) - k * (Ix2 + Iy2);
else
    % Compute Noble's corner measure. det(M) / trace(M)^2
    cim = (Ix2.*Iy2 - Ixy.^2)./(Ix2 + Iy2 + eps);
end
SIGMA_gaussian =

     4
remove boundaries of cim which is going to have large values because of zero padding of the image
BORDER=20;
cim(1:BORDER,:)=0;
cim(end-BORDER:end,:)=0;
cim(:,end-BORDER:end)=0;
cim(:,1:BORDER)=0;
Thresholding the cim
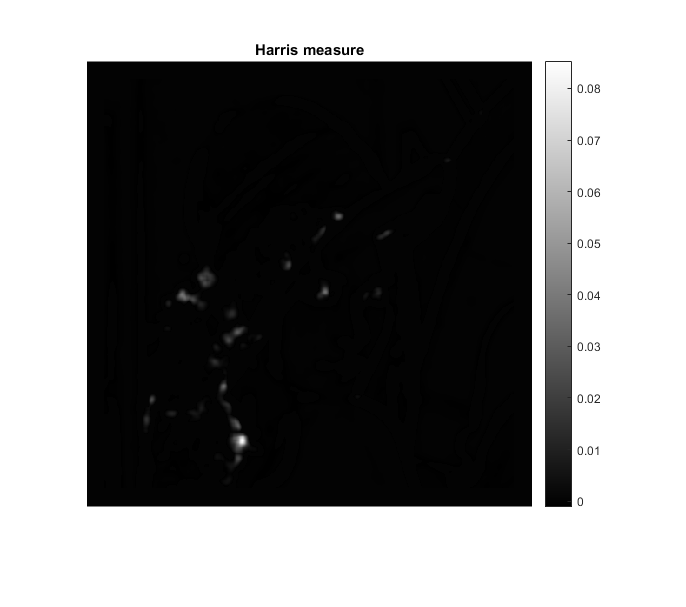
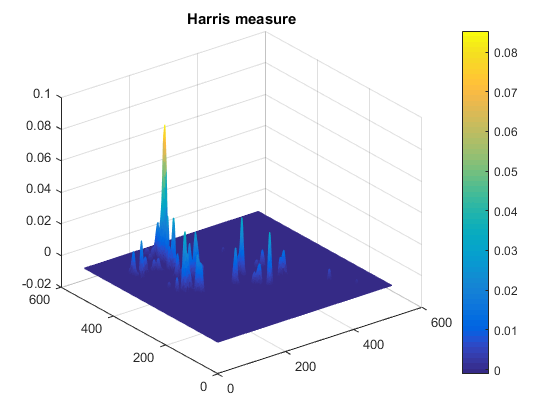
T=mean(cim(:));
CIM=cim;
CIM(find(cim<T))=0;
% similarly one could use the Otzu method

figure(), imshow(CIM,[]),title('Harris measure');
colorbar

figure(34), mesh(CIM),title('Harris measure');
colorbar
perform nonlocal maximum suppression on the thresholded measure
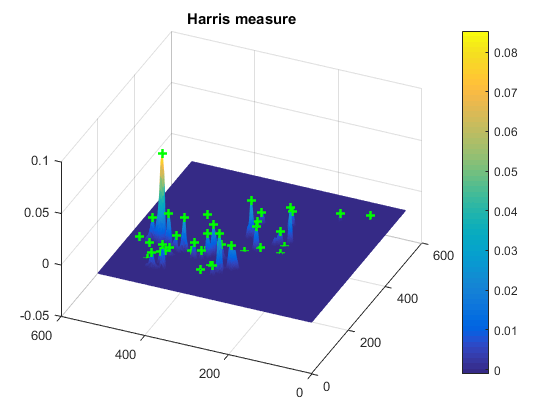
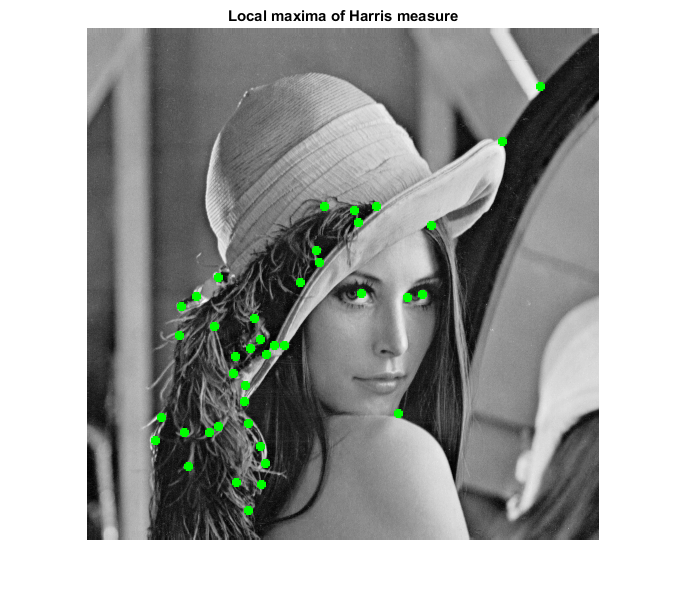
% this value needs to be adjsted also depending on the image size
support=true(11);
% compute maximum over a square neighbor of size 11 x 11
maxima=ordfilt2(CIM,sum(support(:)),support);
% determine the locations where the max over the neigh or 11 x 11 corresponds to the cim values
[loc_x,loc_y]=find((cim==maxima).*(CIM>0));
indx = find((cim==maxima).*(CIM>0));

disp('local maxima on the cim measure displayed as a mesh')
figure(34),
hold on
plot3(loc_y,loc_x, cim(indx), 'g+', 'LineWidth', 2)
hold off
view(gca,[-66.3 42.8]);


% draw a cross on the image in the local maxima
figure(), imshow(y,[]), hold on,
plot(loc_y,loc_x,'g+', 'LineWidth', 4)
title('Local maxima of Harris measure')
local maxima on the cim measure displayed as a mesh